Actioning Alerts
To access your alerts, click on the Notification icon in the left-hand navigation. This will take you to a summary of your notifications.
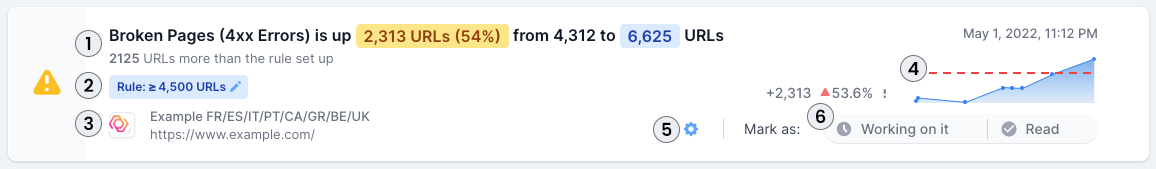
- Information about the alert the notification relates to. This includes the metric affected, the change from the previous crawl (in absolute numbers and percentages), and the number of URLs in relation to the rule settings.
- The rule that is triggering the alert. You can use the pencil icon to edit the rule.
- The project the notification relates to.
- On the right hand side, you’ll also see a summary of information, the trend graph for previous crawls and the date and time of the notification.
- Clicking the gear icon will take you to the manage alerts page.
- You can also mark the notification as ‘Archive’ or ‘Working on it’ so other people seeing the notification know if it has been actioned.
From the alerts screen, you can click into the main body of the notification to be taken to the relevant report in Analyze, so you can quickly see more information and diagnose the issue.
You can also see notifications by clicking on the notification in the top right corner of the dashboard screen.