Creating Technical SEO Boards and Dashboards
Lumar Monitor provides dashboards to help you easily spot spikes or trends in accessibility issues across multiple sites or important sections of your site.
You can view a 'How To' tour by clicking on the gif below or read on for step-by-step instructions on how to create Dashboards in Monitor.

Once you’ve logged into Lumar Monitor, click ‘New’ at the top left of your screen.

You’ll now see the ‘Create new board’ screen where you can give your new board a name. Underneath this you’ll see:
- Available views on the left hand side, which displays all of the views available across the whole account, filterable by project name or domain, segment name and crawl frequency. ‘All URLs’ indicates the entire project (i.e. no segment selected) whereas segment views will have the name of the segment indicated.
- Selected views on the right and side, which shows the specific views you have chosen to use in this board and any of its dashboards.

To select a view, simply click on the ‘Add’ button to move it from the available views list to the selected views list. By default, all views selected in the board settings will display on new dashboards, but you’ll be able to customize this later.
After you select your desired views, click on “Next” at the top right of your page.
You’ll then see an option to choose a template. These have pre-set metrics that you can use to get started and customize rather than building a dashboard from scratch, to help save you time and quickly get up and running with Monitor.
The templates available are as follows:
| Dashboard Type | Description | Columns | Top Graph |
| Link Health | Overview of link health issues across a group of sites. | Broken Pages (4xx Errors) 5xx Errors Broken JS/CSS Broken Sitemap Links Error Pages with Backlinks All Broken Redirects |
Broken Pages (4xx Errors) |
| Redirects | Overview of redirect issues across a group of sites. | All Redirects 301 Redirects Non-301s All Broken Redirects Redirect loops Redirect chains |
All Redirects |
| Canonicals | Overview of canonical issues across a group of sites. | Pages without canonical Canonical to non-200 Canonicalized and no-indexed Conflicting canonical tags Rendered canonical mismatch Orphaned canonical pages |
Pages without Canonical |
| Sitemap Hygiene | Overview of sitemap hygiene issues across a group of sites. | Pages in Sitemaps Pages not in sitemaps Broken Sitemap Links Non-Indexable URLs in sitemaps Disallowed/Malformed URLs in Sitemaps Broken/Disallowed Sitemaps |
XML Sitemaps |
| Content | Overview of technical content issues across a group of sites. | Missing H1 Tags Duplicate Pages Empty Pages Missing Titles Duplicate Titles Missing description Short description Pages with Duplicate Descriptions Pages with Duplicate Body |
Missing H1 Tags |
| Performance | Overview of key metrics indicating speed and UX across a group of sites. | Poor CLS Slow Time to First Byte Slow FCP Slow LCP Slow DCL Slow TTI |
Poor CLS |
If Health Scores are part of your plan, you can now easily monitor them across your entire portfolio of websites, all in one place. This helps you direct your attention to where it matters most so you can prioritize effectively. Monitor allows you to create a Health Scores dashboard to give you a high-level overview of each of your websites’ technical health over these important areas:
- Overall accessibility score
- Availability
- Indexability
- Uniqueness
- Discoverability
- Rankability
- Experience
You can also add subcategory health scores into your dashboards, to focus on specific areas as needed. The subcategory templates available are for Indexability, Discoverability, Rankability and Experience.
To select a particular template, just click into the box on the left of the template you want to use. The list of reports included in the template will then populate on the right side of the screen.

Once you have selected the templates you want to use, click ‘Create board’ in the top right hand corner of the screen.
Once you have multiple dashboards created, you can drag and drop your Monitor boards in the left hand navigation, so you can keep the most important at the top of your list. To reorder the boards, simply hover your mouse over the board name so you see the hand icon, click and drag to its new position. Please note that the board order will be reflected across all users in the account.

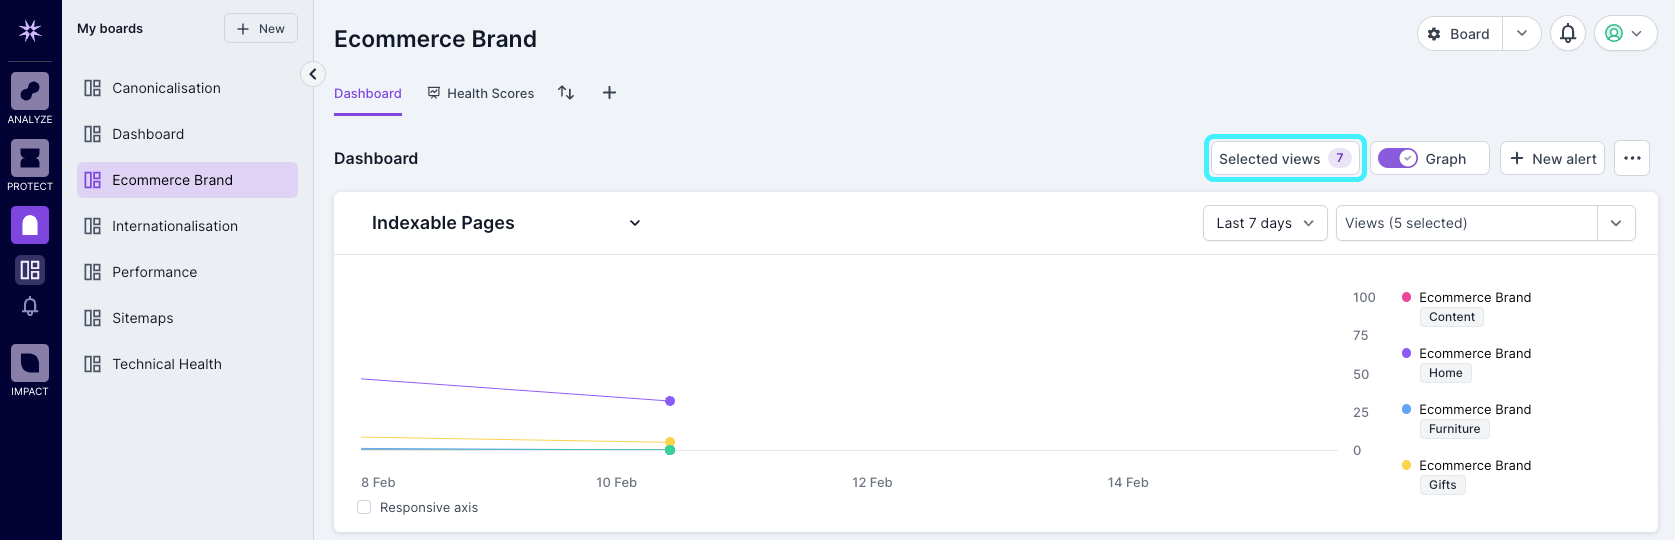
To customize each dashboard, the “selected views” options allow you to show or hide views from the list selected in the board settings. Once this has been set, you can then choose which of the views you’ll see in the top graph.

With each dashboard, you’ll see the trend lines for each metric and each project. As new scheduled crawls complete in the platform, the data will become available in Monitor. Within each cell, you’ll see the following information:
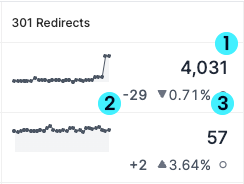
- The total number of pages in the last crawl for the relevant metric.
- The absolute change in the number of pages compared with the previous crawl.
- The % of difference in pages compared to the previous crawl.
Clicking on the relevant trend graph will take you to the corresponding report in Analyze.