When working with reports in Lumar, you can customize the reports to focus in on the data you need. In this article we'll talk through how to change the reports to suit your needs. Follow our click-through guide, or read on for the detail below.
Table View vs Grid View
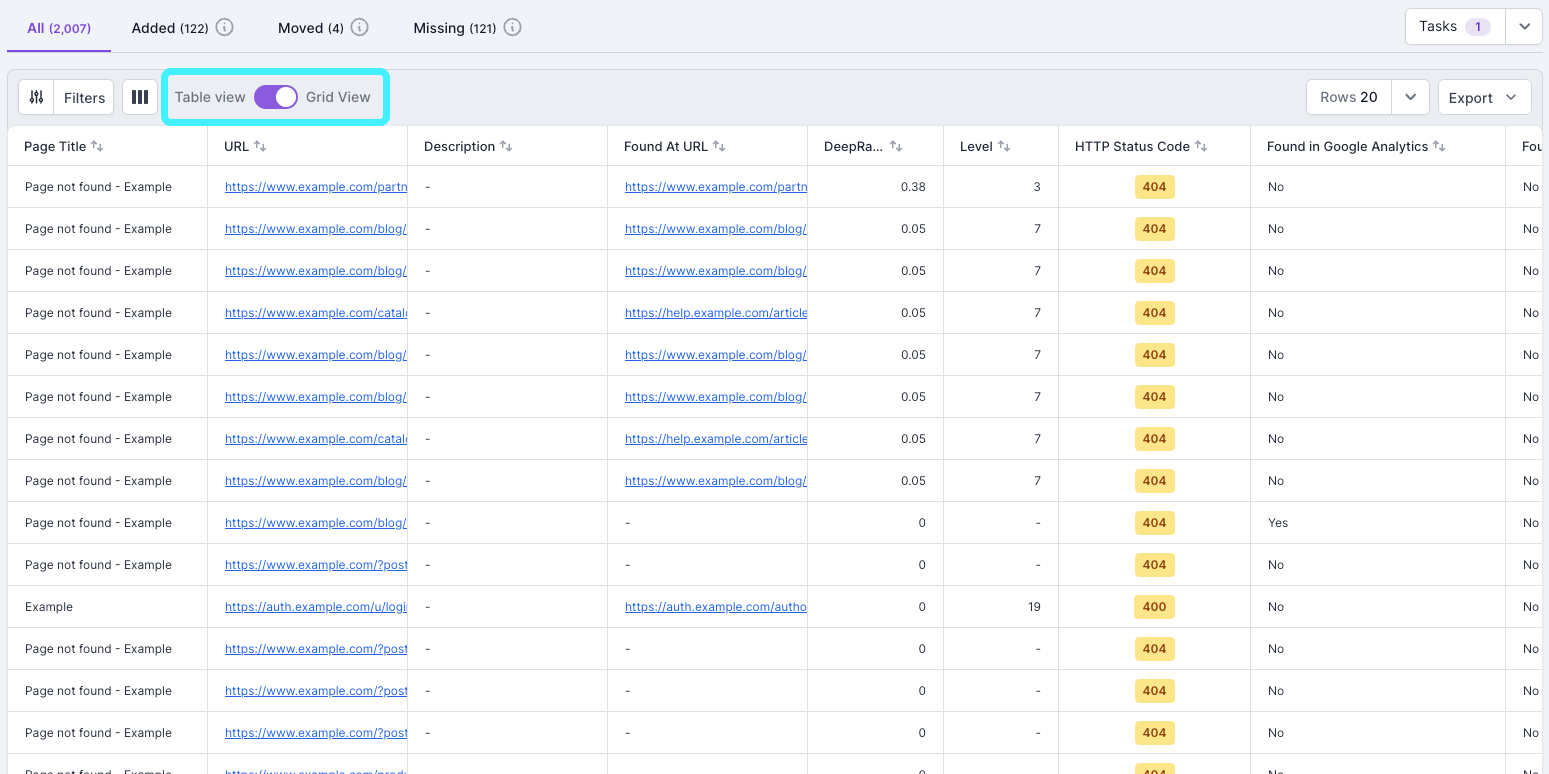
Just above the report table (under the graph) you'll see a toggle to switch between the table view and grid view. In the table view, key information is grouped into the first URL Details column, whereas in the group view, these details are split into separate columns.
Table View
Grid View

Adding Columns
To add columns to the report, click on the column icon next to the switch between table and grid view. You'll see the columns already selected at the top of the list, and underneath you can select additional columns to add. Just toggle the reports you need on or off as required.
Moving Columns
To move columns within the report, just click and hold on the column header and move it to where you'd like it in the report.
Sorting Reports
You can click on the sort icon in the column header to quickly sort by that column. Alternatively, you can click on the column options to choose whether to sort by ascending or descending. In here, you'll also be able to remove a sort. Once a column is sorted, the icon will change to show you which column is sorted, and how.
Filtering Reports
Click on the filter icon to set the filters you need to focus in the data you need. You can choose from a range of options, including contains or does not contain, starts with, ends with, is empty, etc. You can also combine filters using the 'AND' and 'OR' options to get the exact data you need.
Changing the Number of Rows
You can change the number of rows that appear in the report by using the drop down on the right of the report. You can choose to see 10, 20, 50 or 100 rows.